Active Listings in Chiefland, FL
Search homes, rentals, and properties in Chiefland, FL. Filter by price, bedrooms, square feet, and features.
Chiefland, FL offers an active real estate market with 75 available listings, including 75 homes for sale and 0 rentals based on the current property database.
Chiefland, FL stands out for combining active inventory, varied housing styles, and opportunities across different budgets. It is a useful city for comparing buy, rent, and investment options based on lifestyle, location, and property type.
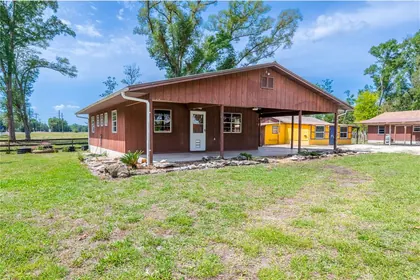
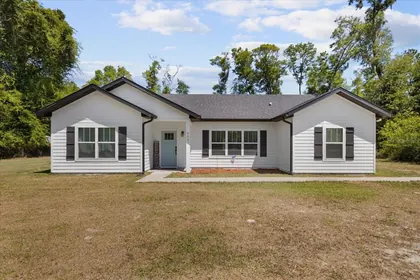
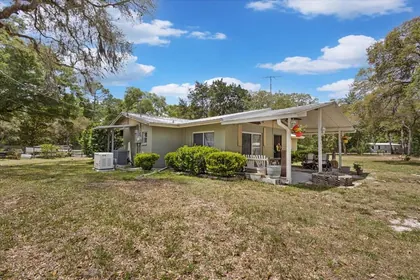
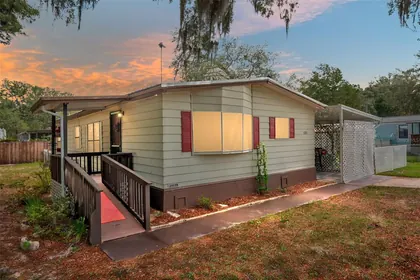
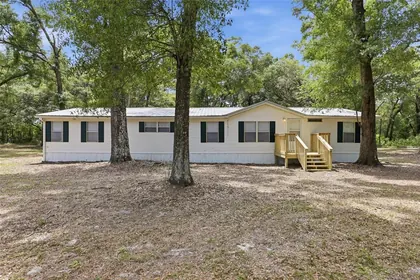
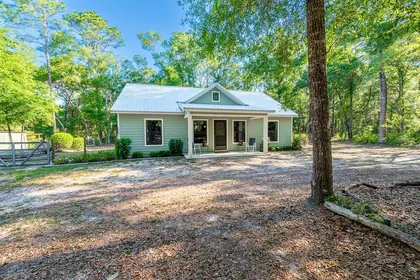
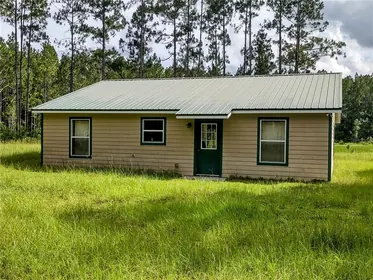
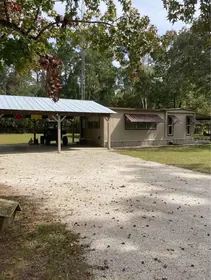
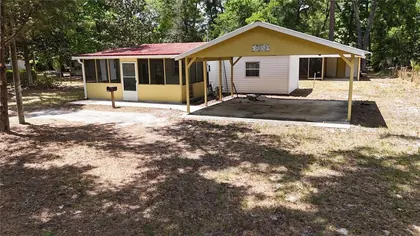
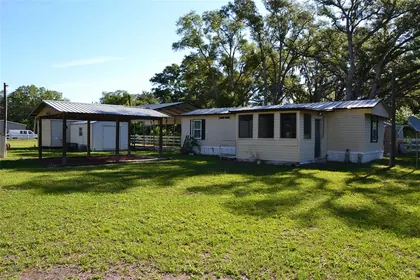
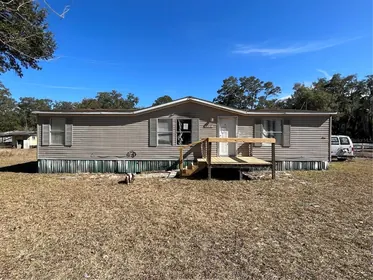
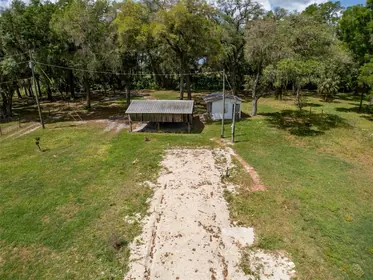
Visible property types in this market include Land, Single Family Residence, Manufactured Home, giving buyers, renters, and investors a practical way to compare different housing styles.
The database also shows activity in local areas and communities such as CHIEFLAND COUNTRY ESTATES, BUCK BAY PH 3, JEMLANDS, which can help narrow the search within the city.
Listings with MLS details show an approximate 3.0 bedroom average and about 2,173 average square feet.
Updated from active MLS data
CHIEFLAND, FL is showing a steady MLS feed profile based on active listings, recent listing updates, and current pricing distribution.
Over the last 7 days, 13 active listings refreshed in the feed, compared with 14 in the prior 7-day window. That puts current market velocity at 16.7% of active inventory.
Pricing dynamics show a median active price of $230,000, an average active price of $257,302, and a median price per square foot near $192.
Average days on market for active inventory is 90.8 days, based on 78 active MLS records with DOM or on-market date data.
Price drop pressure is at 1.3%, with 1 active listings showing a price reduction signal in the trailing 30 days.
The average sale-to-list price ratio is 76.8% across 8 recent closed MLS records where both close price and original asking price were available.
Most visible subareas in the current feed include CHIEFLAND COUNTRY ESTATES, 32626, 32644.
Neighborhood schema mapped from active MLS inventory
CHIEFLAND: Top local areas are ranked by active MLS inventory, with quick links into the city search.
Featured listings
All listings